What is a heatmap used for? Today, heat mapping turns into an effective online tool for mouse tracking and data analysis of user behavior on a website. That is why experienced UX professionals, marketers, and SEO professionals rely on such tools to record clicks, mouseovers, scrolls, and other user experience website interactions to improve conversion rate.
What is a heatmap?
What is a heat map? The heatmap definition is as follows:
It is a way to visualize statistical data about a web resource using a color palette. It allows you to track current trends, evaluate landing page optimization, and identify objects that attract the most attention from users.
What does a heatmap show?
What does a heat map show? It’s a variety of data, in fact. Heat maps are used by digital marketers, sociologists, engineers, and researchers for comparative analysis of statistical data and so much more.
What else heat maps are needed for? In order to understand why the site has a low conversion rate, you may create one. One of the options for raising the conversion is to improve the appearance of the website. In order to understand which changes are effective, you can use the data from the heat map.
How does a heatmap work?
The heat map operates on the basis of information that it receives from web resources. First, it performs a statistical slice of the page, which, after loading using JavaScript, redirects to the Heatmap service. Based on the received data, a map of all site elements that users work with is formed. The service then collects data on visitor activity. As soon as a new user starts interacting with the site, information about the visitors, etc. is entered into the created heat map after that you may create the interpretation of the heatmap in terms of your marketing goals.
Types of website heatmaps
There are 5 main heatmap types for websites you may come across and try for your website heat map meaning. Here they are:
1. Eye-tracking heatmaps
Eye-tracking heatmap aims to gather and visualize data about the most and the least attention-capturing sections and elements of a particular web page.
2. AI-generated attention heatmaps
An AI-generated attention heat map may show which elements in your web design are most likely to be noticed by your users and which are not. Previously gathered eye-tracking data is applied to mimic human vision and foresee where people look. They show eye movement data, unlike mouse tracking heatmaps.
3. Click maps
A click map (or click map) is a type of website heat map example that may display where exactly your users click the mouse cursor on a desktop device or any other interface.
4. Mouse tracking heatmaps
A mouse recorder is a tool that helps to record the movements of the mouse on a website. So when someone visits your website pages, a mouse recorder snaps all their interactions there with the mouse movements as well as mouse clicks if any.
5. Scroll maps
If you apply a scroll map, you use another tool that measures the average fold on website pages by automatically counting where users scroll the most and finish their scrolling at the end of the session, for both desktop and mobile.
Why should you use a website heatmap?
When is the best chance to use heat maps? Heatmap technology is one of the main tools of digital and content marketers. It shows the greatest efficiency in the following cases:
- Content marketing.
With the help of a heat map, the optimal content size and winning positions for the placement of CTA buttons are determined.
- A/B testing.
Using a heat map, you can test and select different landing options, and determine the effectiveness of the location of site elements and CTA buttons.
- Redesign
With the help of Heatmap services, you can track user behavior at each stage of the redesign. This allows you to evaluate its effectiveness compared to the previous version.
How do I create a website heatmap?
how to use heatmap or create it first? To compile a Heatmap, you can use specialized online services with a heat map algorithm for data visualization, for example, Heat-Map. co, MouseFlow, HotJar or Creabl.
The pros and cons of heatmaps
Site heatmaps are an underrated tool in many ways. Often site owners are not aware of their existence at all. And this is a big drawback because working with heat maps gives a lot of advantages to a business owner, marketer, website developer, or content marketing specialist. We see at least 4 advantages:
Now let’s proceed to the heat map advantages and disadvantages.
- Data visualization.
Color visualization allows you to present large amounts of data in the most simple and visual form. This saves time for analytics because looking at a heat map is much easier than working with the same data, but presented in tables.
- Opportunity to improve the site.
Heatmap analysis will tell you which elements to make clickable, which sections to remove from the text, where to place an advertising banner, and where to add a call to action in order to increase the efficiency of traffic processing and site conversion.
- Usability improvement.
By increasing the functionality of site elements, such as capture forms, by making the transition from section to section noticeable, you want the site to be more convenient for visitors – and they perceive it more loyally.
- The growth of the position of the site in the search results.
By improving the content, visual design, and usability based on heat map data, you can reduce the number of bounces, and increase the time of user sessions – search robots will see this, and the site will rank better in search results
Nevertheless, you may also come across certain limitations of a heatmap that may affect your work process as the heat maps also have their downsides.
- Insufficiency of data.
The main disadvantage is that the marketer or the owner of the site/business is tempted to draw conclusions only on the basis of heat map data. In fact, it is more rational to use other analytical tools so that the reliability of the data is the best.
- Most heatmapping services are paid.
The cost of using the full functionality of such services can be very tangible for startups and small businesses.
Heatmap examples
When to use heatmap? Heatmap is really an umbrella term for different heatmapping tools: scroll maps, click maps, and move maps. In fact, there are numerous cases when you may resort to using heatmaps in your work practice and make a heat map data analysis to improve your results. In the end, you get the patterns like that to process:
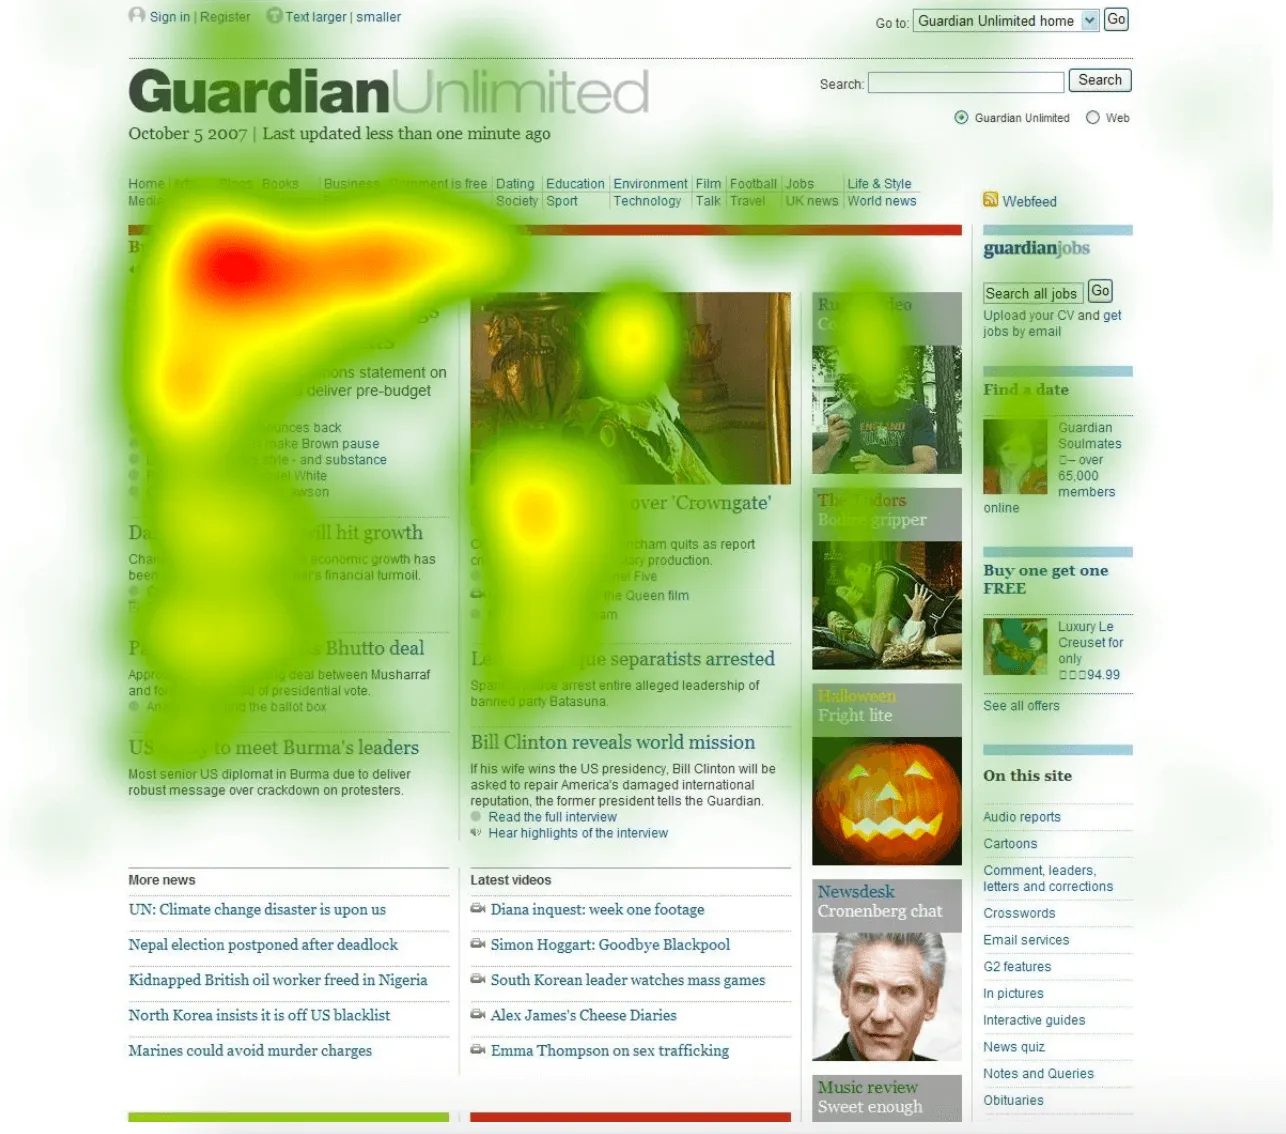
An F pattern website heatmap:
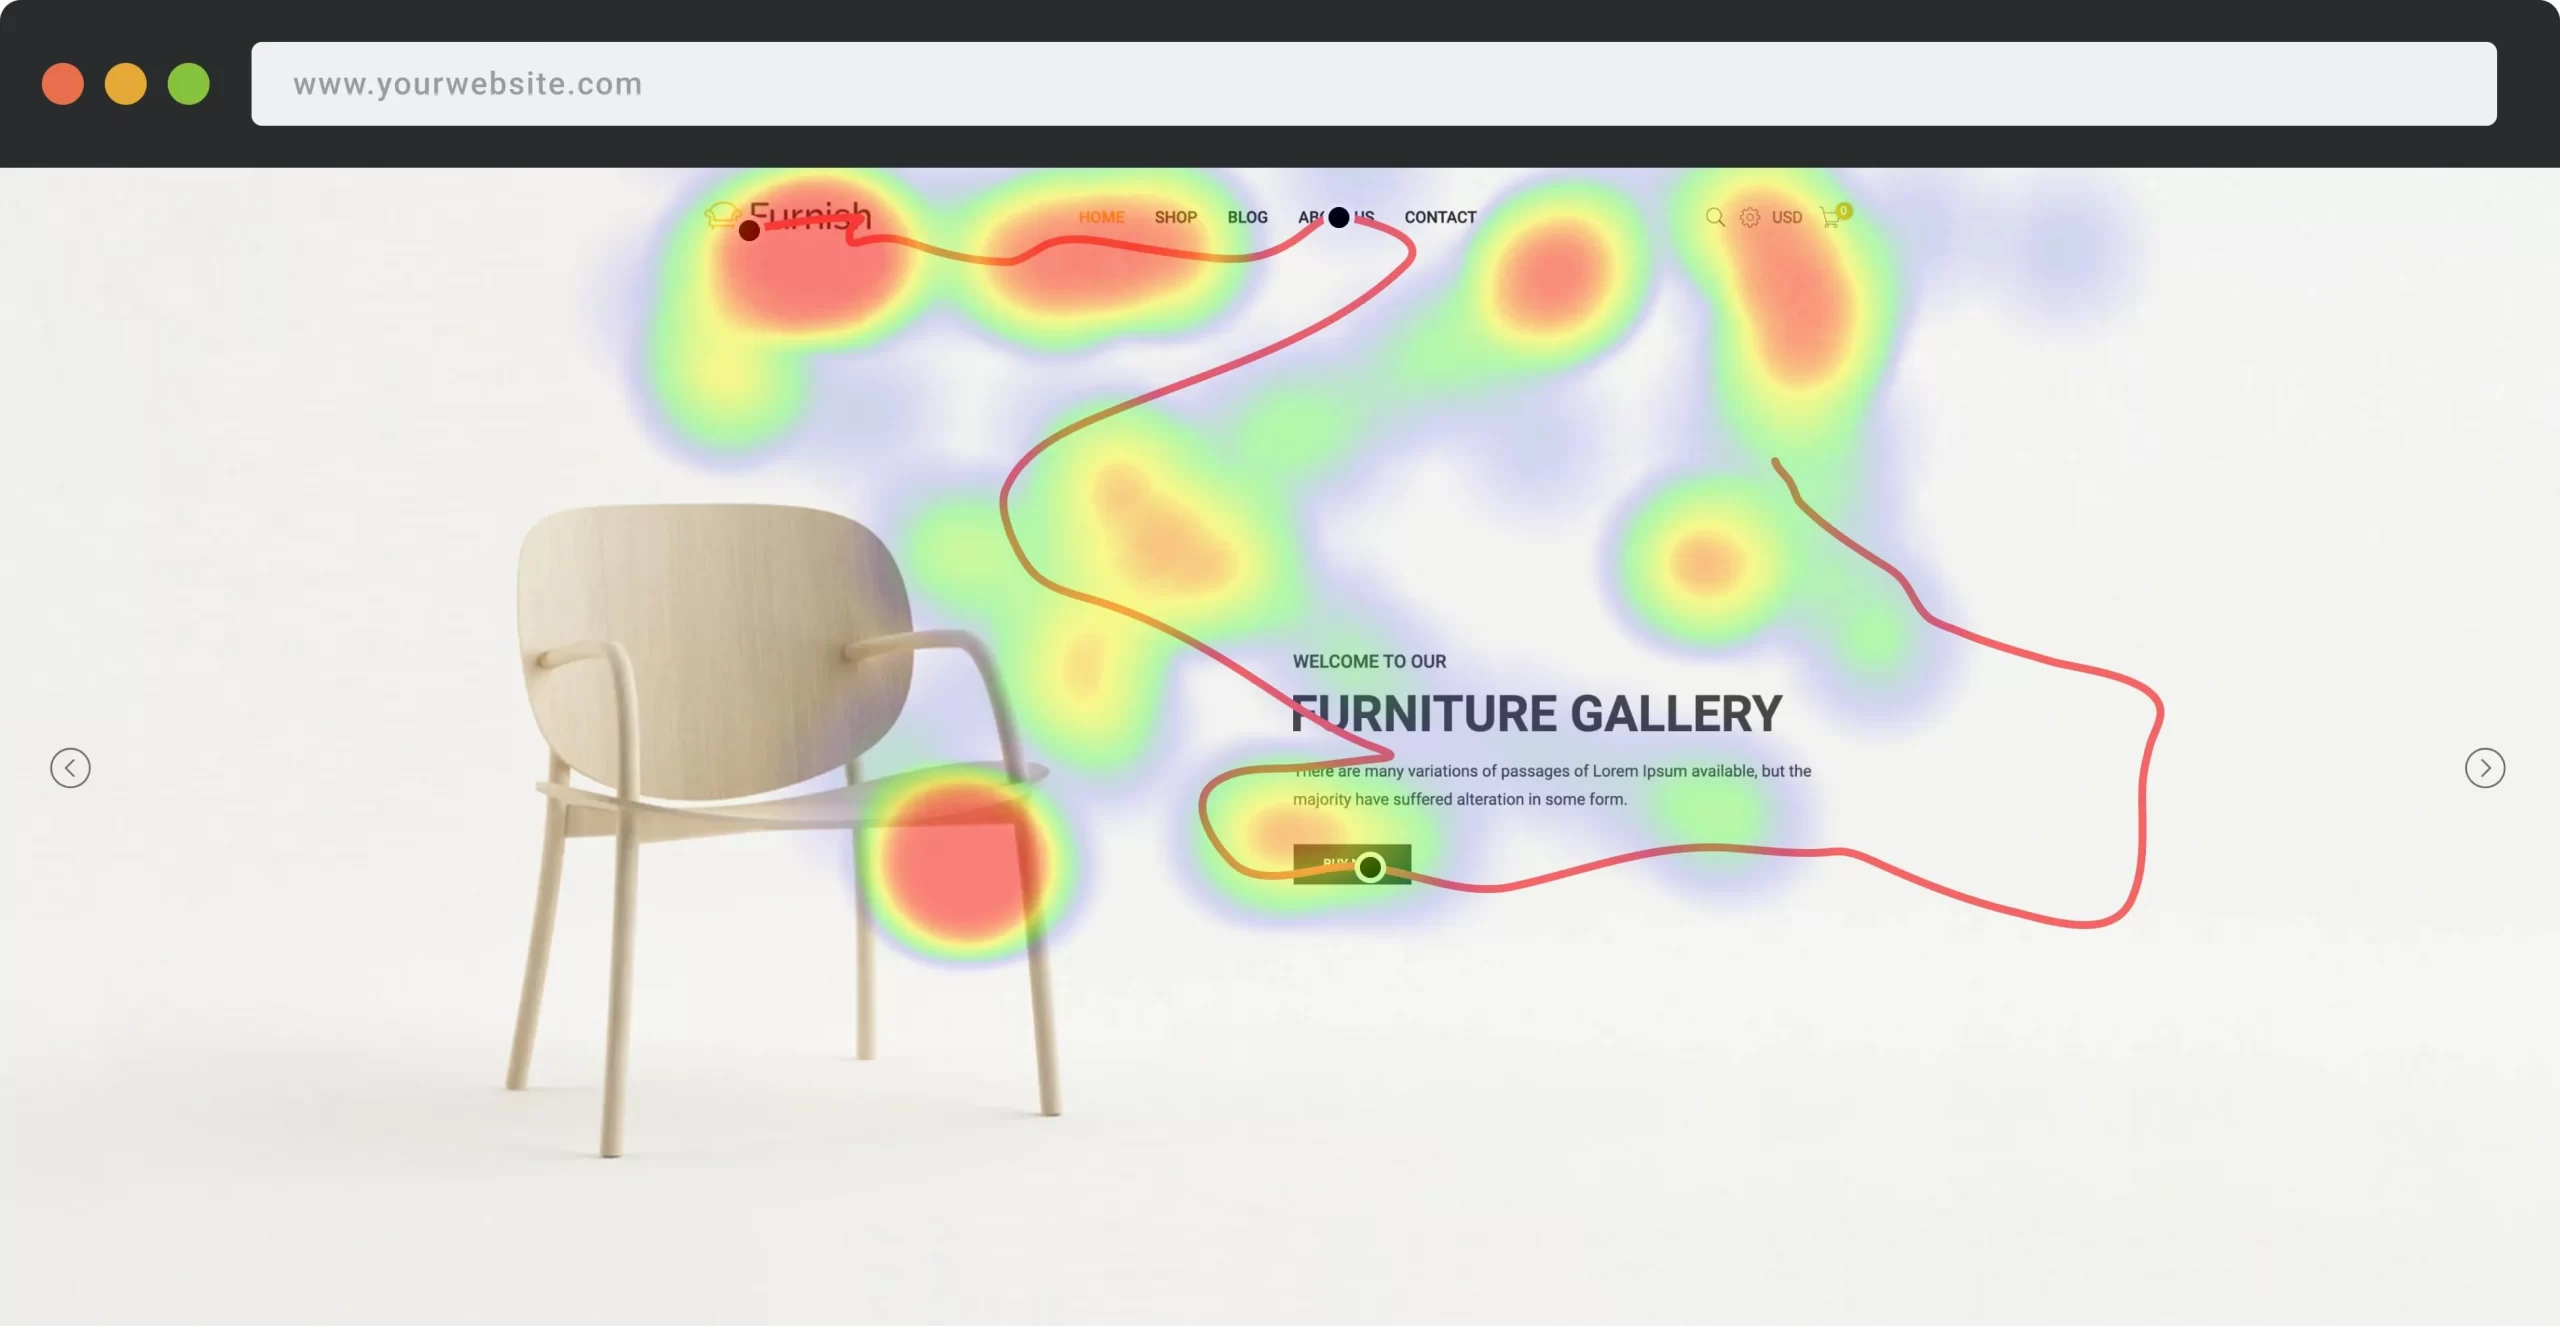
 Click tracking heatmaps:
![]() Movement engagement pattern:
Movement engagement pattern:

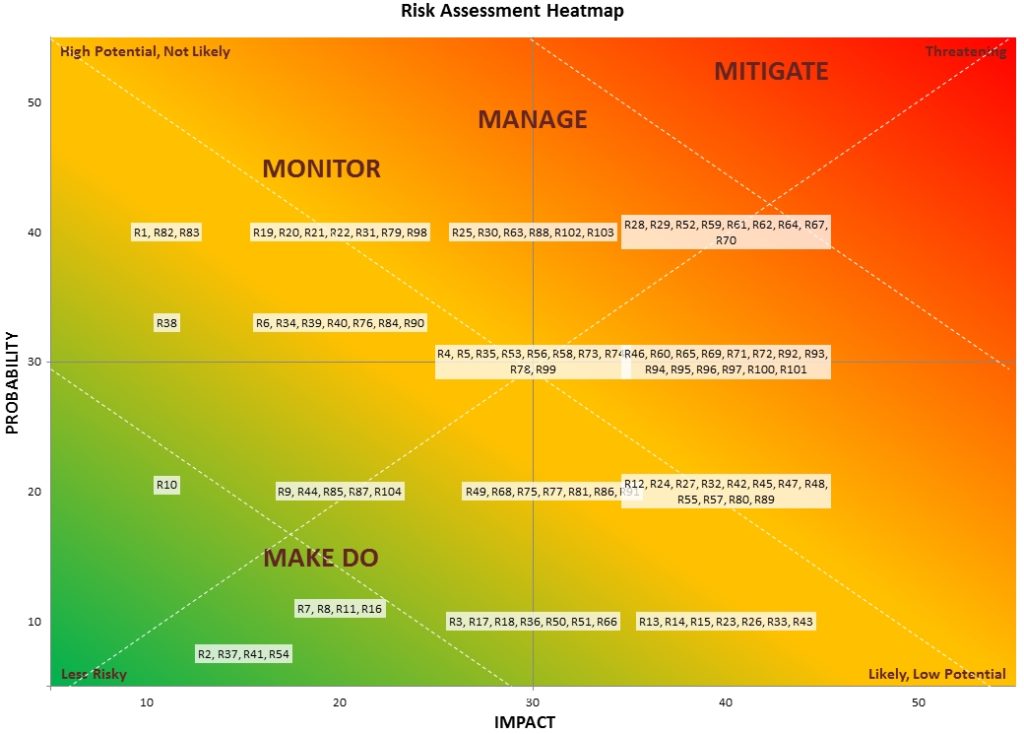
There exist a Risk mapping too:

A risk heat map is a tool used to present the results of a risk assessment process visually and in a meaningful and concise way. The higher the activity of visitors, the brighter and warmer the colors, and vice versa, the less action, the colder and more muted the colors.
Final thoughts
Site heatmaps are an underestimated tool in many ways. Often site owners are not aware of their existence at all. And this is a big drawback because working with heat maps gives a lot of advantages to a business owner, marketer, website developer, or content marketing specialist.
First of all, marketers of online stores and other commercial projects want to see a complete and constant picture of user behavior on the site. Also, heat maps are an indispensable tool for usability specialists, analysts, UX designers, and SEO specialists. Conducting a full usability audit of the site is impossible without taking into account the real statistics of clicks and hover on elements, as well as page scroll indicators, etc.
FAQ
What is a website heatmap?
It is a way to visualize statistical data about a web resource using a color palette. It allows you to track current trends, evaluate landing page optimization, and identify objects that attract the most attention from users.
What is a heatmap used for?
How does a heatmap work? Giving a direct overview of key web performance, it provides visual paths to understanding numeric values, making it easier to learn from users to create more user-friendly web design, etc. So, you know your visitors better and provide them with a better experience.
How do I make a heatmap?
- Enter data. Enter the necessary data in a new sheet.
- Select the dataset for which you want to generate a heatmap.
- Use formatting if allowed.
- Select the color scale.
- Get finalized data.
How do I read a heatmap?
You may easily read any website heatmap in two ways: by looking at the visualization and by reviewing the raw data points. You can spot mouse click trends and issues at a glance thanks to the color-coded heat mapping nature.
How do I analyze a heatmap?
In short, an image is divided into a grid, and within each square, the heat map shows the relative intensity of values captured by your eye. . It provides easy-to-read color overlays for your site so you can understand where your trouble spots are, and quickly see where your content needs improving. To analyze the data, track from the warmest color to the coldest ones to see the changes in your data.
Who invented heatmaps?
Although initially used for temperatures, heatmaps are now used for many types of data. However, initially, the term heatmap was trademarked back in the early 1990s. A software designer Cormac Kinney created a tool to graphically display real-time financial market information.
Can I use a heatmap on my Shopify store?
As a website tracking tool, heat maps can help open the lid and let you see your visitors’ behavior on your website of any type.
Can I use a heatmap on WordPress?
Yes, heatmaps for WordPress can serve as a real-time analytics and mouse-tracking plugin.
What’s the difference between mouse-tracking and eye-tracking tools?
Mouse tracking analytics follows the mouse movements of an internet user to simulate eye movement on a webpage. Meanwhile, eye tracking, as used by top enterprises such as Google, uses cameras and specialist software to track where the eyes of internet users land on a webpage.
How should I use heatmaps with other analytics tools?
The most effective way to use heatmaps is by combining them with other web analytics tools. This way, you can get a deeper understanding of how your site performs or not.
Will heatmaps slow down my website?
The Creabl script has been designed to have a minimal site performance effect. Since every JavaScript code piece, you add to your site may affect your site in some way, there are no guarantees that your site will not be affected at all in either way. You should try it out.
